How Lasso Analyzes Weight Training: Sets, Rest Time, and Cardiovascular Metrics
A deep dive into how we extract meaningful insights from your heart rate data during strength training sessions.
Introduction
Weight training presents a unique challenge for activity analysis: unlike running or cycling where heart rate patterns are relatively smooth, strength training creates distinct heart rate spikes during sets followed by recovery periods. At Lasso, we've developed sophisticated algorithms to detect these patterns, automatically identify sets and rest periods, and calculate advanced metrics like Cardiovascular Fitness Index (CFI), Metabolic Equivalent of Task (MET), and Rate of Perceived Exertion (RPE).

The Heart Rate Pattern
During a typical weight training session, your heart rate follows a predictable pattern:
- Set begins: Heart rate rises rapidly (often 2.5+ BPM per second)
- During set: Heart rate peaks and may fluctuate
- Set ends: Heart rate begins declining
- Rest period: Heart rate returns toward baseline
This creates a "sawtooth" pattern in your heart rate data that we can detect and analyze.
Step 1: Data Preprocessing
Parsing Heart Rate Data
Most fitness trackers and wearables provide heart rate data as an array of values sampled at approximately 1 Hz (one sample per second). We first convert this into timestamped pairs:
              timestamp = start_time + (index × sampling_interval)

              hr_point = [timestamp, heart_rate_value]
Smoothing the Signal
Raw heart rate data can be noisy. We apply a 7-second moving average window to smooth the signal while preserving the important patterns:
              window = [timestamp - 3.5s, timestamp + 3.5s]

              smoothed_hr = average(hr_values in window)
This smoothing helps reduce false positives from brief heart rate fluctuations while maintaining the ability to detect rapid rises and falls.
Step 2: Detecting Sets and Rest Periods
We use a state machine approach to detect sets and rest periods by analyzing heart rate changes:
Key Thresholds
| Parameter | Value | Purpose |
|---|---|---|
| HR Elevation Threshold | 8 BPM above baseline | Minimum elevation to consider a set |
| Rapid Rise Threshold | 2.5 BPM/second | Detect start of set |
| Min Set Duration | 8 seconds | Filter out brief spikes |
| Min Rest Duration | 10 seconds | Filter out brief pauses |
Detection Algorithm
The algorithm works in two phases:
- Calculate baseline HR: We use the median of the lower 30% of heart rate values to establish a baseline, which accounts for individual fitness levels.
-
State machine detection:
- Looking for set start: Detect rapid HR rise (>2.5 BPM/s) or elevated HR with sustained rise
- During set: Track peak HR and monitor for decline
- Set end: Detect when HR drops significantly from peak (>8 BPM) or returns near baseline
- Rest period: Period between sets where HR is declining or stable
Merging Close Sets
Sometimes heart rate fluctuates during a single set, causing the algorithm to split one set into multiple. We merge sets that are separated by very short rests (< 20 seconds), as these are likely part of the same set.
Step 3: Calculating Rest Time
Once sets are identified, calculating rest time is straightforward:
              rest_period = next_set_start_time - current_set_end_time

              avg_rest_time = sum(all_rest_periods) / number_of_rests
We only count rest periods that are at least 10 seconds long to avoid counting brief pauses within sets.
Step 4: Advanced Metrics
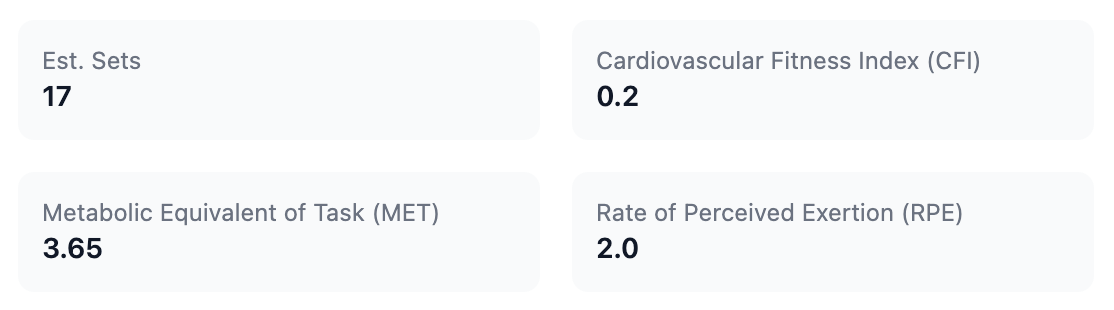
Cardiovascular Fitness Index (CFI)
CFI measures how quickly your heart rate recovers after sets, indicating cardiovascular fitness:
              HRR60 = average(HR at set end - HR 60 seconds after set end)

              CFI = HRR60 / (peak_HR - resting_HR)
| CFI Range | Fitness Level |
|---|---|
| < 0.15 | Very Low / High Fatigue |
| 0.15 - 0.25 | Below Average |
| 0.25 - 0.40 | Moderate (Average) |
| 0.40 - 0.55 | Strong (Good Fitness) |
| 0.55 - 0.70 | Very Strong (High-Level) |
| ≥ 0.70 | Exceptional (Elite) |
Metabolic Equivalent of Task (MET)
MET measures exercise intensity based on energy expenditure:
METs = Calories / (Body Weight (kg) × Time (hours))
| MET Range | Classification |
|---|---|
| 3 - 6 | Strength-Oriented Training |
| 6 - 10 | Metabolic Conditioning |
| > 10 | Very High Intensity |
Rate of Perceived Exertion (RPE)
RPE estimates workout intensity on a 1-10 scale using a weighted combination of three factors:
RPE = (HR Peak Score × 0.50) + (HR Variability Score × 0.30) + (Calorie Score × 0.20)
HR Peak Score: Based on time spent in high-intensity heart rate zones (Zone 3: 70-80%, Zone 4: 80-90%, Zone 5: 90-100% of max HR)
HR Variability Score: Coefficient of variation (CV) of heart rate - higher variability indicates higher intensity
Calorie Score: Ratio of actual calories burned to expected baseline calories for weight training
| RPE | Perceived Exertion |
|---|---|
| 1 | Very, very light |
| 2-3 | Very light |
| 4-5 | Moderate |
| 6-7 | Hard |
| 8-9 | Very hard |
| 10 | Maximum |
Limitations and Considerations
While our algorithms are sophisticated, there are some limitations:
- Heart rate data required: All analysis depends on having heart rate data from your activity
- Minimum duration: Activities need at least 10 heart rate data points to be analyzed
- Set detection accuracy: Very short sets (<8 seconds) or sets with minimal HR elevation may not be detected
- Rest time accuracy: Brief pauses within sets (<20 seconds) are merged into the set
- User vitals needed: CFI and MET calculations require recent weight and resting heart rate data
Conclusion
By analyzing heart rate patterns during weight training, Lasso automatically extracts meaningful insights about your workout structure and intensity. These metrics help you understand not just what you did, but how your body responded—providing valuable feedback for training optimization and progress tracking.
The combination of set detection, rest time analysis, and advanced cardiovascular metrics gives you a comprehensive view of your strength training sessions that goes far beyond what traditional activity tracking provides.